top of page
  • Writer: Ziggurat Realestatecorp
    Ziggurat Realestatecorp
  • Sep 18
  • 6 min read

UK Buyers today will have to spend seven times their salary on a home — but those in the 1970s faced double-digit mortgage rates.


Much debate rages around which generation actually had it worse when it came to getting onto the property ladder. Many baby boomers, those born between 1946 and 1964, remember the painful days of mortgage rates as high as 17 per cent, while today’s first-time buyers are contending with comparatively higher house prices.

The estate agency Hamptons looked at the data to try to work out which generation had the worst deal. Here is what it found.


Whose homes lost value?


Despite an overall rise in house prices those Generation Z first-time buyers who got on the ladder in 2020 would be the first to have experienced real-terms property values fall during their first five years of ownership. Average prices have dropped 3 per cent when adjusted for inflation, accordiong to Hamptons.


A typical millennial (those born between 1981 and 1995) who bought their first home in 2011 in their mid-twenties made an average real-terms gain of 13 per cent over five years. Whereas a Generation Xer (born between 1966-1980) who bought their first home in 1996 enjoyed 44 per cent growth in real terms over the first five years.


ree

Hamptons said that a baby boomer first-time buyer in 1979 benefited from average real-terms house price growth of 35 per cent in the first five years. Someone of the so-called silent generation (born between 1928-1945) who bought a first home in 1968 saw the value of their home rise 106 per cent in real terms in the first five years.

Having struggled to get on the property ladder, the youngest homeowners now face being stuck on the first rung.


Whose house prices boomed?


In April 1968 the average house price was 4.29 times the typical annual salary, according to the Office for National Statistics. This, apart from two spikes in the early 1970s and late 1980s to early 1990s, remained largely constant for the rest of the 20th century. An average home in April 1979 was 4.29 times the average wage, and 3.8 times in April 1996.


But a period of sustained house price growth followed, with the average property rising 173 per cent between 1995 and 2007 in real terms, causing the gap between wages and property values to widen.


ree

In April 2011 the average home was 6.58 times the average salary. In April 2020, this had increased to more than 7.69, hitting a peak of 8.23 in September 2022.


David Fell, an analyst at Hamptons, said: “House prices have risen much faster than wages over the last couple of decades mostly thanks to falling mortgage rates. Since interest rates were reduced to rock bottom levels in response to the 2007 house market crash, buyers could generally borrow significantly more money than someone earning the same salary 20 or 30 years ago, pushing prices up.”


Whose payments were highest?


Between the mid-1970s and early 1990s the Bank of England base rate, which influences mortgage rates, was often in double figures, hitting a high of 17 per cent between November 1979 and July 1980.


In response to the 2007-08 financial crisis it was cut to 1 per cent in February 2009 and remained at this rate or lower until June 2022, when the Bank began raising it in an attempt to tackle inflation. It hit a high of 5.25 per cent in August 2023 and is on the way down again now — this month it was cut from 4.25 per cent to 4 per cent. The average mortgage rate offered across the market is 5 per cent, according to the analytics firm Moneyfacts.


But Neal Hudson from the property market researcher Residential Analysts said that lower mortgage rates only tell part of the story.


“Yes the rates were higher in the 1970s and 1980s, but these people were borrowing much lower multiples of their income,” he said. “Buyers are now borrowing nearly double what they were back then, so it takes a much lower mortgage rate to create the same level of pain.”


Someone paying the average house price of £213,000 in January 2020 would have paid £73,900 in mortgage payments on the average rate of 3 per cent. Hamptons based its calculations on someone with a 10 per cent deposit and a 25-year mortgage term.


A homeowner who bought in 2011 — when the average house price was £234,000 and the base rate was 0.5 per cent — would have spent £48,700 on their mortgage in the first five years, assuming they had the average mortgage rate of 1.7 per cent.


ree

Yet someone who bought at the start of 1979, when the average house price was £13,800 and the base rate was 14 per cent, would have spent £41,500 on their mortgage in the first five years of homeownership, assuming the average 9.6 per cent mortgage rate and adjusting for 2025 prices. The 1979 average house price would be £55,100 in real terms today.


Fell said: “Millennials faced higher purchase prices than the previous two generations but much lower interest rates, while the boomers and Gen X paid higher interest rates but the prices were lower.


“Gen Zers, however, are being hit with relatively high prices and relatively high interest rates now as well.”


Who has the least equity?


Sluggish house prices combined with higher borrowing costs will also make it more difficult for those looking to move because they will struggle to build up enough equity to fund a switch to a bigger home.


Hudson said: “Previous generations have benefited from house-price growth to allow them to move into larger properties, whereas these days, it’s much harder and so you’re seeing people moving much less frequently.”


ree

Using Bank of England data that predicts mortgage rates up to 40 years in the future, Hamptons estimates that the average homeowner who bought in 2020 would pay about £191,000 across the first half of a 25-year mortgage term. Over the second half of their term, they would pay £208,000.


It is a far cry from the experience of older generations. The typical baby boomer first-time buyer paid £93,900 in real terms in the first half of their 25-year mortgage, dropping to £64,700 in the second half. Those belonging to Generation X paid an average of £112,294 in the first half, falling to £75,697 in the second.


Recent increases in mortgage rates have also caught out millennials. Hamptons forecasts that this generation will have to pay £185,600 on average in mortgage payments across the second half of their mortgage, well above the £117,500 they paid the first half.


“In previous generations, homeowners would have climbed up the career ladder and inflation would have made the second half of their mortgage easier financially,” Fell said. “With millennials and Gen Z likely to see their mortgage payments rise, it will erode that feeling that their loans are getting more manageable.”


He said this was likely to mean fewer members of those generations paying off their mortgage early — a key milestone for anyone wanting to retire early.


What about the renters?


Those waiting to buy their first home generally need to either live with their parents or navigate the rental market, where costs have never been higher.


The average monthly rent in July 2025 was £1,373 a month — 47 per cent higher than ten years ago. It cost more than three times as much in real terms to rent in the last five years than it did for someone who started a five-year tenancy in 1979.


Someone who started renting in January 2020 would have paid an average of £86,750 over five years, having been caught up in the post-pandemic boom in rents. Someone who started a tenancy in 2011 would have paid £74,283 over five years in real terms, while someone who started renting 1979 would have paid £23,740 in today’s prices.

Higher rental costs make it more difficult to build up enough savings for a house deposit, exacerbating the challenges of getting on the property ladder amid inflated house prices.


ree

For boomers and those in the silent generation, renting was cheaper than paying a mortgage. the average tenant who started renting in 1968 would have paid £6,500 over the first five years in real terms, compared with £7,990 in mortgage payments. Rental costs for someone who started a tenancy in 1979 were £23,740 for the first five years, compared with £41,470 in mortgage payments.


But the pendulum swung the other way for the first time in October 1992, the month after Black Wednesday, when the pound crashed and Bank rate was cut. Since then, monthly rental payments have mostly remained higher than mortgage costs, according to Hamptons.


The average buyer who bought in 2020 and paid mortgage payments for five years would have paid £12,900 less than the average renter. “This has created a bit of a financial cliff edge between those who bought and those who didn’t, in a way which didn’t exist for older generations,” Fell said.


  • Writer: Ziggurat Realestatecorp
    Ziggurat Realestatecorp
  • Aug 28
  • 3 min read

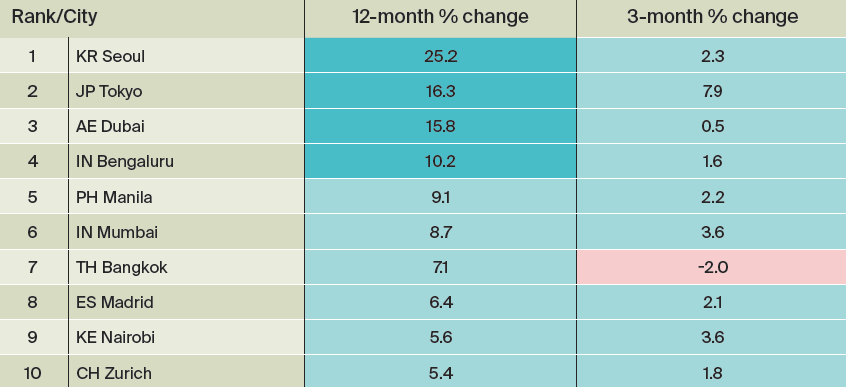
Prime residential prices in Manila rose by 9.1% year on year in the second quarter, ranking the Philippine capital fifth among global cities for price growth, according to the latest edition of Knight Frank’s Prime Global Cities Index (PGCI).


This represents a slowdown from the 26% year-on-year surge recorded in the same period last year, when Manila topped the global rankings.


The PGCI is a valuation-based index that monitors prime residential price movements in 46 cities worldwide, using data from Knight Frank’s global research network. It measures nominal prices in local currency.


Year on year, Manila’s prime residential price growth trailed only Seoul (25.2%), Tokyo (16.3%), Dubai (15.8%), and Bengaluru (10.2%), but outperformed Mumbai (8.7%), Bangkok (7.1%), Madrid (6.4%), Nairobi (5.6%), and Zurich (5.4%).


ree

Manila’s prime residential prices grew faster in April-June than the 1.6% decline recorded in the first quarter.


Over the past five years, Manila ranked among the top markets in terms of real estate price growth at 77.5%, behind only Tokyo (120%), Dubai (107%), Seoul (80.9%), and Miami (80.3%).


Manila’s five-year price growth also outpaced that of Los Angeles (56%), Christchurch (43.9%), Gold Coast (34.2%), Shanghai (32.8%), and San Francisco (32.6%).


“Emerging hotspots like Manila and Christchurch highlight increasing investor appetite in secondary cities,” Knight Frank said.


“Asian cities continue to lead the rankings, but with less vigor than in previous quarters,” it added.


Manila’s prime residential prices also outpaced the 2.3% global price growth in the second quarter.


“We’re seeing a more fragmented market, with some European cities showing surprising strength while former high-flyers in Asia begin to level off,” Liam Bailey, global head of research at Knight Frank, was quoted as saying in the report.


Another analyst commenting on the report, Joey Roi H. Bondoc, director and head of research at Colliers Philippines, said strong demand for units amid limited supply may be helping support Manila’s prime residential market.


“The upper luxury, ultra-luxury segments continue to outperform other market segments, especially the mid-income segment, because the latter is very sensitive to mortgage rates,” he said.


“On the other hand, luxury buyers are awash with cash. If they don’t have the cash right now, probably they sell one or two of their units and then buy another luxury unit.”

The luxury residential segment — typically valued at P20 million and above — has only 3% remaining inventory of ready-for-occupancy units, far below the 32% inventory recorded in the lower middle-income segment, Colliers said in its Second Quarter Property Market Report.


“By prime residential prices, they may be referring to newly launched luxury condominiums in the Core Central Business Districts of Makati, BGC (Bonifacio Global City) and Ortigas. These constitute a very small percentage of the total condominium supply in the market, but are the highest priced units,” Roy Amado L. Golez, Jr., director of research and consultancy at Leechiu Property Consultants, said.


In the coming months, Mr. Bondoc expects more property developers to pivot toward the luxury residential segment.


“More developers will become more prudent when it comes to their launches, but they will cater to the luxury market… so, the share of luxury in the total new launches in Metro Manila will continue to increase,” he added.


“I would tend to think that inflation, interest rates and other factors such as financing and the sourcing of high-end luxury materials will continue to nudge pricing upwards,” Mr. Golez also said.


  • Writer: Ziggurat Realestatecorp
    Ziggurat Realestatecorp
  • Jun 30
  • 2 min read

Residential property prices in the Philippines continued to increase, although at a slower pace, during the first quarter of 2025 (Q1 2025), the Bangko Sentral ng Pilipinas (BSP) reported.


Year-on-year growth of the Residential Property Price Index (RPPI) slowed to 7.6 percent in January-March from 9.8 percent in the last three months of 2024. On a quarter-on-quarter basis, prices reversed from the fourth quarter of last year’s 1.0-percent drop, growing by 2.6 percent.


ree

The National Capital Region (NCR) led residential property price growth with a 13.9-percent increase, significantly higher than the 3.0 percent observed in the rest of the country. Quarter on quarter, the NCR saw a 9.2-percent expansion while areas outside it recorded a 2.1-percent drop.


All areas outside the NCR, with the exception of Metro Cebu, recorded higher prices. Houses in Mindanao became 7.6-percent pricer, followed by the rest of the Greater Manila Area (GMA) at 3.8 percent and other areas in the Philippines at 1.1 percent.


Metro Cebu, on the other hand, registered a 1.7-percent drop — its first annual decrease since the first quarter of 2023.


All housing categories contributed to the higher prices, with condominiums and houses recording growth rates of 10.6 percent and 4.5 percent, respectively. Houses measured include single-attached, detached, town houses, duplexes and apartments.


Quarter on quarter, condominium prices grew by 9.9 percent, offsetting a 2.9-percent drop for houses.


The median price for all housing types was P3.37 million, the BSP said, lower than the P4.34 million for condominiums but above the P2.95 million for houses.


Houses in the NCR were the most expensive with a median price of P7.7 million, while condominiums in other areas in the Philippines were the cheapest at P2.5 million.


Residential real estate loans taken out during the first quarter, meanwhile, were mostly used to purchase new housing units (73.2 percent), with the remaining 26.4 percent and 0.5 percent used to buy pre-owned and foreclosed properties.


By type of housing, 63.7 percent of the loans were used for houses and the rest for condominiums.


Just over a fourth, or 27.4 percent, of the property loans were granted in the NCR. Calabarzon (Cavite, Laguna, Batangas, Rizal and Quezon) accounted for 29.9 percent; Central Luzon, 13.8 percent, Central Visayas, 9.6 percent; Western Visayas, 7.9 percent; Davao, 4.5 percent; and Northern Mindanao (2.5 percent).


The NCR and these six regions accounted for 95.6 percent of housing loans granted by banks, the BSP said.


The RPPI calculates the average change in prices of different kinds of housing units over time from bank data on loans made to purchase residential properties.


The quarterly index, beginning the first quarter of 2025, now uses a different methodology to align with international best practices and has been renamed from the Residential Real Estate Price Index. Among others, it now uses acquisition cost instead of appraised value, and the property type has been expanded to include pre-owned and foreclosed units instead of just new ones.


Instead of just the NCR and areas outside it, the latter has further been divided into balance GMA, Metro Cebu, Metro Mindanao and other areas in the Philippines.


Source: Manila Times


© Copyright 2018 by Ziggurat Real Estate Corp. All Rights Reserved.

  • Facebook Social Icon
  • Instagram
  • Twitter Social Icon
  • flipboard_mrsw
  • RSS
bottom of page